How do Jupiter and Saturn effect each other's orbits?

The vital feature of how Jupiter and Saturn's orbits influence one another was noted by Laplace. With orbits of 29.5~ years and 11.86~ years respectively, Saturn will orbit the Sun twice in a similar time that Jupiter orbits five times. This 2:5 ratio results in Saturn having a duality to its orbit. Jupiter's orbit varies in cycles of five orbits. The result is that the entire solar system fluctuates every 59 years , which reflects the synchronization of these two orbits. Other meaningful planetary cycles are 237 years and 913 years.

The easiest way to describe how this works for the
59 year cycle is to note that after 1 orbit of Saturn, Jupiter would have orbited about 2.5 times. So there is an extra half-orbit of Jupiter that is going to then cause a bias to that single orbit of Saturn. That particular orbit of Saturn will drift to the side of the Sun on which that extra half-orbit of Jupiter occurs. For the next orbit of Saturn, the other half-orbit of Jupiter will cause an opposite bias to Saturn's orbit on the other side of the Sun. We can see this if we follow the Sun's path as it moves due to the gravity of the planets:

Those images were generated by the OGS15 algorithm (orbit-gravity-sim-15.exe). But not every cycle is identical, and there is always an excess or a shortfall from any cycle. After 85 years, the gravity and orbit of Uranus realign the position of the Sun with Jupiter and Saturn. So roughly, 1 orbit for Uranus is 3 orbits for Saturn and 7 for Jupiter. By the same process, after 165 years Neptune's orbit is mostly balanced. But it never perfectly balances.

When we include the orbit of the Earth and Venus and how that effects the average, we need a cycle of 237 years, but when we include more precise ratios of Jupiter, Saturn and Uranus the optimal average now becomes 913 years. If you observe the graphs in the section on Jupiter and Saturn individually, you will see the graphical proof from calculating fluctuations to their aphelions, that the 913 year cycle is clearly best. Thus a better ratio for their orbits is 31:77.

913 years is close to 11 orbits for Uranus, and 1484 orbits of Venus. Mars and Neptune however, are more optimally measured against a bit more than double that amount at 1827 years.

But the 2:5 approximate ratio for Jupiter and Saturn's orbit is still vital in appreciating the duality to 
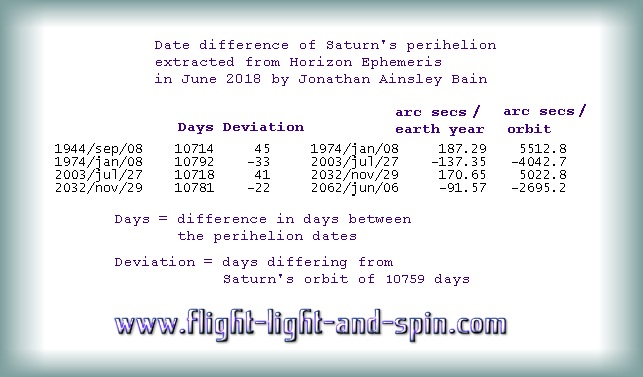
Saturn's orbit. Saturn's orbital duration varies by as much as 6 Earth-days every second orbit due to the influence of Jupiter. But fluctuations to its aphelion and perihelion vary by well over a month! Saturn is also about 10 million km different in distance to the Sun at it most and least extreme individual aphelions, as well as similar fluctuations for perihelions.

There is a bit of a semantic issue here, because aphelion for one single orbit is quite different to the overall aphelion, but actually it is not possible to determine an overall amount here, even over a 3000 year sample. This is because Saturn's orbit is becoming less eccentric. Saturn's aphelion is getting lower by an average of more than 2 million km every thousand years, and its perihelion is increasing by similar margins. (Details are in a table in the section: Saturn).

Thus giving an average for any orbital statistics is fairly meaningless in an overall context. All such averages of orbits, whether for duration, aphelion or perihelion, or any other parameter, need to be placed in the proper context as to which particular orbits are being averaged, dammit! This issue on its own is a massive stumbling block to any such study from a methodological perspective. In the section on Jupiter, a detailed blow-by-blow account is presented of how vital it is that orbital averages be placed in such an authentic context.

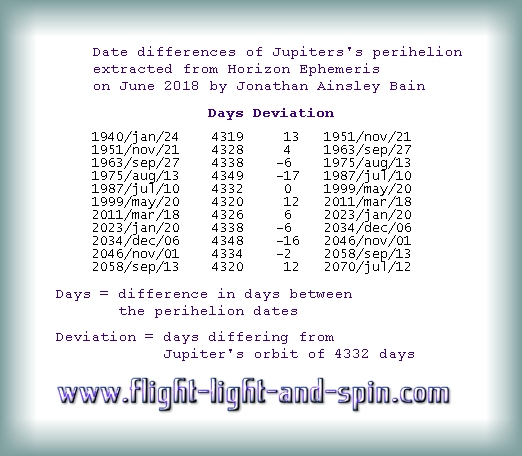
Saturn's perihelion movement is not a constant precession. Jupiter's perihelion also precedes and recedes in cycles of 5 orbits, similar to Saturn's cycles of 2 orbits:


From 1974-2003 there is a deviation for Saturn's perihelion of -33 days for the 10759 days of the orbit. That is nearly -4000 arc-seconds for that orbit. Which is an average of -137 seconds of arc that perihelion has receded per Earth-year during that orbit. And yet, as has been noted earlier, observers from previous centuries have claimed to notice Saturn's Perihelion Precession with an average of 19.5 as/Ey (arc-seconds per Earth-year). Even though as we see in the data above that from 1944 to 2062 the orbit will move by an average of +32 as/Ey.

The algorithm OGS15 gave an agreeable average Perihelion Precession for Saturn from the years 1797 to 2710 AD of 20.01 as/Ey. That was Scenaro [36] computing a 31 orbit sample over 913 years. With the 8 orbit sample, the result was 3.38 as/Ey, which demonstrates how even a 237 year sample does just not yield an adequate average for the outer planets.

The given amounts by Utexas.edu are 19.5 (observed) and 18.36 (theoretical) for perihelion (see Introduction). Though without providing information on to which orbits are quantified, it is a fairly arbitrary comparison.

Jupiter has similar large fluctuations:


The table above shows that the times between perihelions are quite markedly different to the average length of an orbit for Jupiter. Some are less, while others are considerably more.

The commonly quoted observations of Jupiter's Perihelion Precession, as given in the table from utexas.edu earlier (see Introduction) suggests that observers have recorded a Perihelion Precession for Jupiter of 6.5 arc seconds per year (as/Ey), which is about 77 arc seconds for an orbit of Jupiter itself.

Now there are 1296000 arc seconds in any orbit. And with Jupiter having 4332 earth-days in an orbit, its a simple sum (1296000/4332) to see that each day of deviation represents about 300 arc-seconds for the orbit for Jupiter. And that is a fluctuation of about 25 as/Ey for each day of fluctuation.

The biggest deviation of -17 days (1975-1987) is thus a recession of more than 5 thousand arc-seconds for that orbit. After being converted into the standard portions measured per earth-year, the result is that the 17 days equals more than -400 arc seconds per year of Earth (as/Ey). That is quite a massive discrepancy when compared to the quote of the average as 6.5.

(You are perhaps correct in realizing that this would have all been much easier if the convention had been to measure the precession in terms of the orbit itself rather than Earth-years. I offer both to be clear.)

Nevertheless I am struggling to accept that observations of a net average of 6.5 arc seconds per year could be made with the perihelion of Jupiter wobbling about like that. Because that drift of -400 arc seconds per Earth-year (1975-1987)
would need to be diluted by 1000 years to yield an error margin of 6%. Which is not bad, except it would require us to have been observing Jupiter with complex telescopic equipment for more than 1000 years to do this. So it is abundantly clear to me that the 'observations' have been swayed by blatant experimenter-bias in favour of the numerical and theoretical models.

It is thus vital to realize that any theory is based on observations and such observations also involve calculations. And these are based on fundamental laws of mathematics, like Euclidean and Pythagorean geometry. So it is not literally correct to state there is a difference between observation and theory as regards Perihelion Precession, because the table from utexas.edu from earlier can only offer a divergence between two different processes of theoretical-observations.


My best result for precession of Jupiter's Perihelion Precession is thus 7.68 as/Ey, which is far from the 6.55 (observation) and 7.22 (theoretical estimate) on the table of the historical claims (
see Introduction). The 7.68 as/Ey average attained is taken after  1 cycle of 913 years, so that it is synchronous with all the other major planetary motions. This is unlike the historical claims which use the grossly inaccurate average per 100 years.

Of course you may be wondering how reliable that table of deviations of the dates of Jupiter's perihelion is? (Previous image). So here is a sample of what the data looks like directly when sampled from the Horizon Ephemeris:


You will notice that the sample above also includes the extracted data from one day either side of the Perihelion; so that you can easily see that the highlighted sample is at its nearest distance (RG = AU) for that orbit.

So the alleged 'observations' are not in-keeping with modern data for both Jupiter and Saturn. But also that the theoretical account of Newton's gravity is not at all in-keeping with 3D n-body-gravity.

T
he change to the major-axis of Saturn oscillates back-and-forth in pairs of orbits by amounts that at times are more than 3 full degrees at its most extreme orbital fluctuation. That is 6/360 normal degrees between pairs of orbits.

To put this into context of the other studies of Perihelion Precession, the algorithm OGS15 has detected extreme orbital fluctuations for Saturn of as much +-400 as/Ey. Compare this to the alleged observed average of 19.5 as/Ey for Saturn. Its a simple sum to see that a single orbital fluctuation can be the same as the orbital average over 20 orbits, which is 600 years. The only way to mitigate against this is to use synchronous samples of 913 years. Never 100 years, because even the 237 year sample has been show to be too small for Saturn.

If one looks at the various accounts for the distance that Saturn is from the Sun at aphelion, some have it 1505 million km, whereas others put it at 1514.5 million km. Those differences of opinion are always reflected as gross averages out of any meaningful context. Saturn has two quite different orbit paths. Being a 29.5~ year cycle, a single observer in her lifetime would by very confused by her own data. It would be easy to be mislead into thinking that the second observation out of three was full of errors as there would be 59 years between the three observations.


So how logically consistant with itself is the Horizon Ephemeris? I use their date of 24 January 1940 (Jupiter perihelion) as the starting point for some scenarios. Other scenarios start at the perihelion of Earth in 1900, and also the perihelion of Jupiter in 1773.

But although those 3 starting dates use Horizon Ephemeris data, thereafter the algorithms evolve purely according to Newtonian-Planck gravity. Reflected differences with Horizon are within 4 minutes and 4113 km from the years 1773-1999 for my best approximation for Jupiter. See Scenarios [25] of OGS15 in the section on Jupiter.

Now had I begun by saying that my algorithms detect a wobble in the perihelion of Saturn by more than 12000 arc seconds per orbit, I suspect nobody would have believed me. I didn't believe me at first either! Only when I realized that Jupiter was also wobbling perihelion back and forth by large amounts; and, that my 2D algorithm had already got close agreement for those dates with Horizon, did I finally realize that my algorithms are correct in principle, even if there will always be tiny disagreements/inaccuracies/approximations.

Its one thing to generate huge amounts of synthetic quantitative data a posteriori. But! Its quite another to closely observe what that data actually means in terms of what Kant called the the analytic a priori. Such is the difference between astronomer and philosopher. Such is also the value of not relying on others to do your thinking for you. If you are an astrophysicist who is not constructing your own 3D-n-body-gravity-algorithm you are just copy-pasting the errors of centuries past. I have supplied the essential solution from my source code for your convenience at his link: Build N-body-gravity Algorithm

 
see also orbit details of: — JupiterSaturn

Sections of this Article by web-page


n-body gravity from www.flight-light-and-spin.com