The
pattern is clear that the variations to Saturn's aphelion
are becoming greater individually as well as for its average.
While in the previous section we saw how those amounts for
Jupiter were diminishing individually, but increasing on average.
The important point here is that taking an average is only
meaningful if that average fits into an amount that is divisible
by the cycles in the graph. For both Jupiter and Saturn follow
the same cycle 913 years: 31
orbits for Saturn and 77 orbits for Jupiter.
Is it possible that observational data is reliable on that
time-frame? Maybe not for us, but detail of this study could
become relevant 700 years from now.
The following table is divided into two sections, the first
3 samples showing variations against the
average, whereas the second 3 samples show
the better averages in the 913 year cycles.
This is the same data used to make the graphs above, from
Scenario [66] of OGS15 beginning
1900 AD.
| orbit |
precesion
average
as/Ey
|
orbit
average
in days |
duration
1
orbit
in days |
perihelion
average
mil-km |
perihelion
1 orbit
mil-km |
aphelion
average
mil-km |
aphelion
1 orbit
mil-km |
| 1
|
- |
- |
10754.7 |
- |
1350.4 |
- |
1503.0 |
| 7 |
-29.7 |
10753.7 |
10749.3 |
1349.6 |
1350.5 |
1504.3 |
1503.5 |
| 16 |
7.3 |
10757.0 |
10770.5 |
1349.0 |
1347.7 |
1505.7 |
1507.9 |
| |
|
|
|
|
|
|
|
| 31 |
20.7 |
10759.2 |
10756.1 |
1349.9 |
1352.7 |
1505.1 |
1502.1 |
| 62 |
21.5 |
10759.3 |
10757.1 |
1352.2 |
1357.3 |
1502.8 |
1497.6 |
| 93 |
21.8 |
10759.3 |
10757.8 |
1354.9 |
1362.1 |
1500.4 |
1492.9 |
As
you can see, the average perihelion increases its distance,
whereas the average aphelion decreases its distance. This
clearly shows that the orbit of Saturn must be in a process
of circularizing.
Remember NASA's 'fact sheet'
gave a maximum distance 15014.5 million
km, whilst NASA's Horizon
Ephemeris offers 15005
million km. We need to be mindful that there is a difference
between the average maximum, and the ultimate maximum.
However in Scenario [26], Saturn begins
its first aphelion of August 1782 at a
distance of 1509 million km and never again
reaches that far out, with aphelion getting closer to the
Sun. From 3609 AD the
aphelion is always below 1500 million km
up until to my last calculation 5423 AD,
showing that the orbit is getting less eccentric. This is
also clear in the graph because the perihelion is increasing
its distance over this time-frame.
Its not suprising to me that the detail of Saturn's orbit
is so inconsitent in NASA's published data, yielding
that difference of 10 million km (1%)
to the aphelion. This is because Saturn yields very few
orbits in any given time-frame, and is also radically effected
by Jupiter. So because nobody else is using a genuine 3D-n-body-gravity
evolutionary algorithm, that lack of understanding will
result in a substantial errors in such predictions.
We also need realize that whenever we see an 'average' distance
from the Sun; or an average for distance of Perihelion or
Aphelion; or an average for Perihelion Precession - or indeed
the Aphelion Precession - then it should always
be qualified by the number of orbits, and also the specific
starting orbit. Those averages vary considerably - and in
effect there is no overall average.
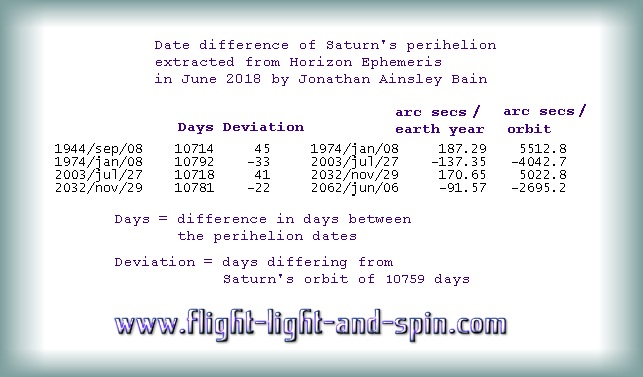
As we can see from the individual samples in the graph,
the duration of Saturn's year varies by more than 20
days. This is over 2400 arc-seconds for
the orbit or 80 arc-seconds per year of
Earth. Jupiter really plays havoc with Saturn's orbit. So
its no surprise that there are such radical discrepencies
in measurements of Saturn's orbit. If you look at the last
column on the graph above you can see that individual samples
vary by at least by 15 million km as regards
Saturns aphelion.
We get s similar problem with Jupiter when trying to determine
if any post-Newtonian theory is affecting either orbit.
The observation for Saturn is given as 19.5
as/Ey whereas the least Newtonian prediction from my algorithm
averages 20.66
as/Ey. Relativity is supposed to increase that Newtonian
prediction, not decrease it! So
once more the data has to be counted as proof against any
Relativistic prediction.
however,
our source data (see Introduction)
claims that the Newtonian prediction should be 18.36
as/Ey. But that was not calculated by an evolutionary process
that uses a 3d-n-body-gravity algorithm.
That was a 2D numerical process. So we
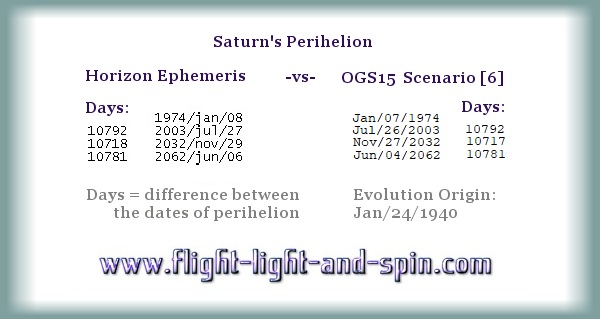
need to compare Horizon Ephemeris and OGS15 to
see the amount of agreement.