So
the item J is actually the value most in-agreement
with OGS15. Of course it is not ideal to
exclude the Z-axis in measurement terms
of the angle between Perihelions. But I can only compare
values in the terms they have been presented to me.
As it is; including the Z-axis for measurement
of the angle; and including the Z-axis
for evolution of gravity; tend to partially cancel one another
out. That is why items J and K
appear to be very close together. Item K
is my answer as to the real value of Mercury's Perihelion
Precession. Its has been blanched of all experimenter bias,
2D confusion, and Post-Newtonian sophistry.
| . |
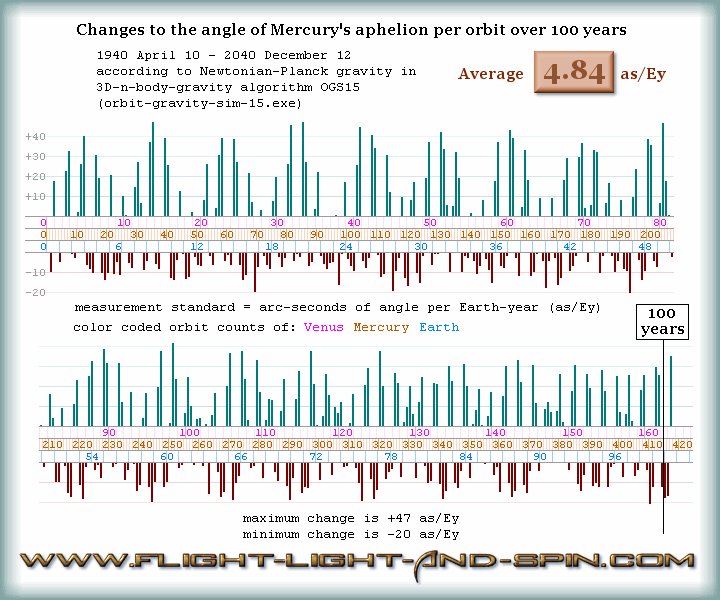
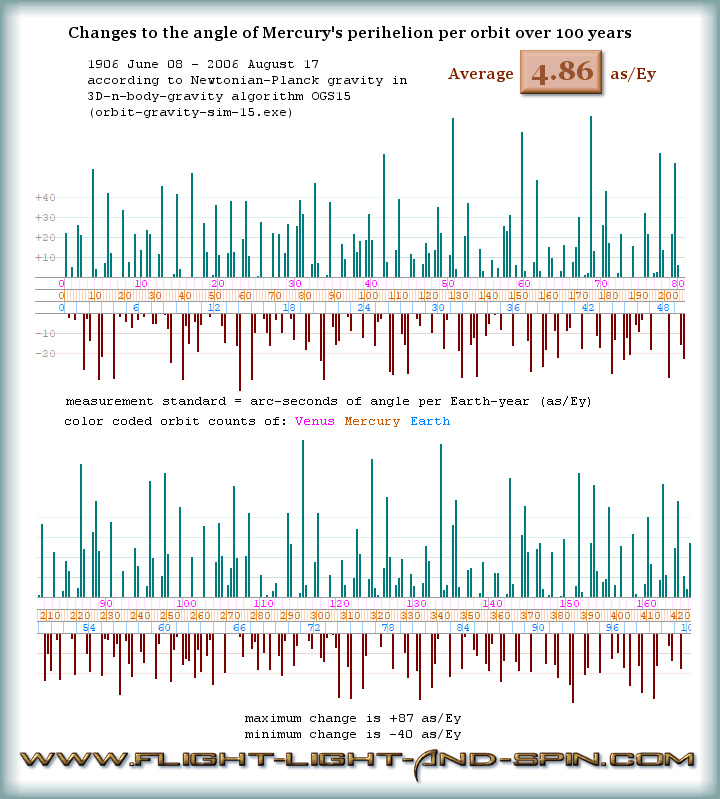
Perihelion
Precession average for Mercury in 3D
evolution:
5.07
or
4.84
arc-seconds per year
depending on measurment standard/technique in
3D or 2D
|
| .
|
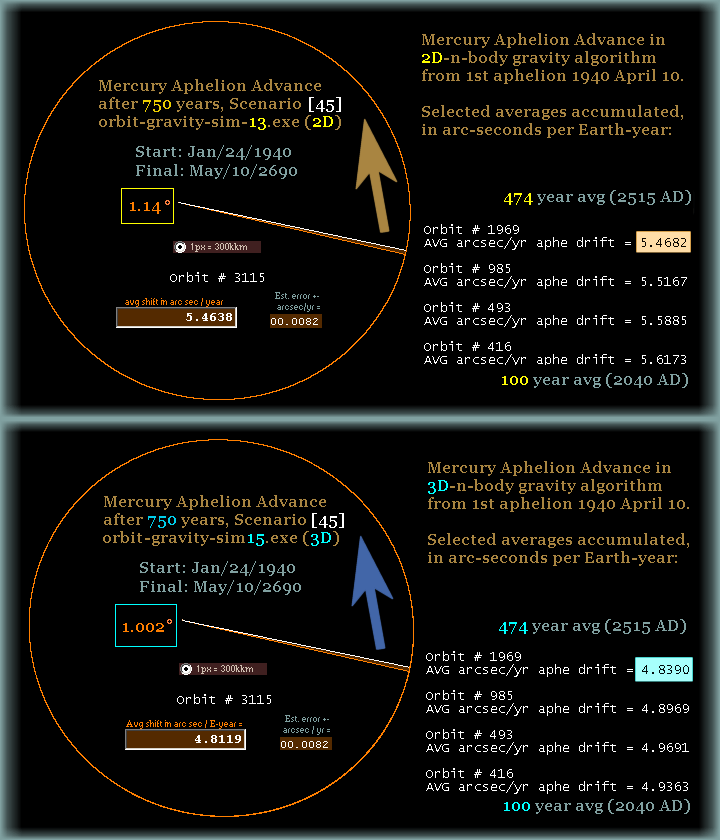
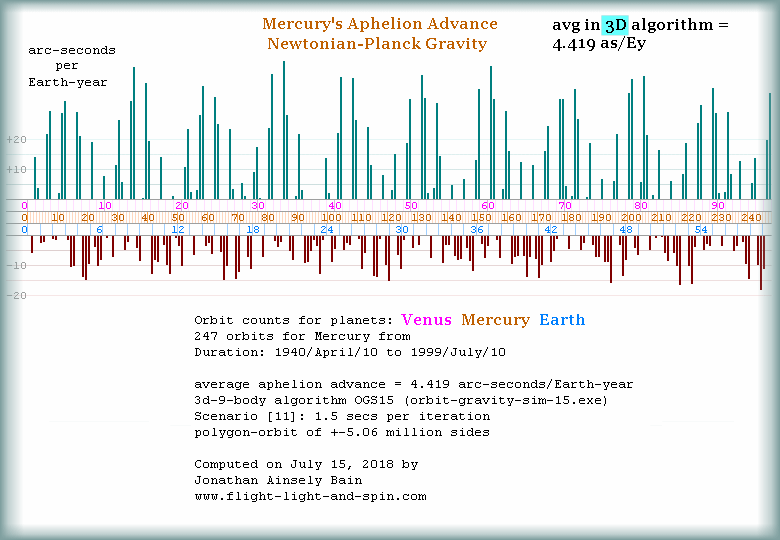
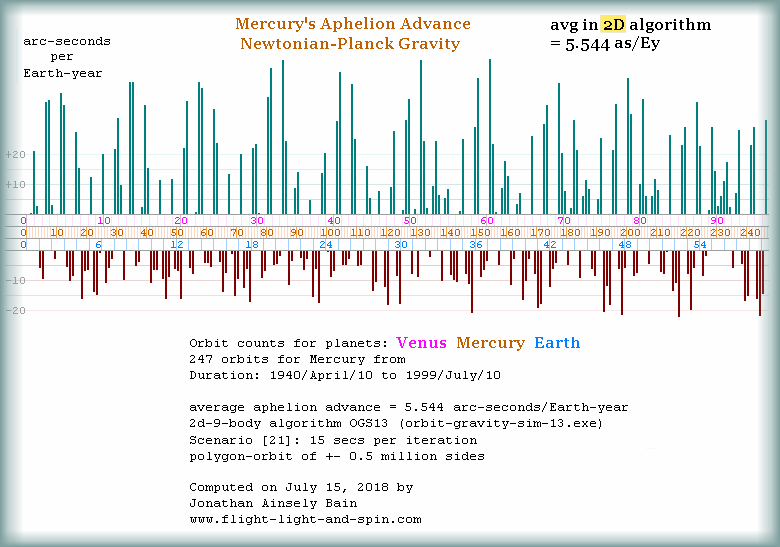
But
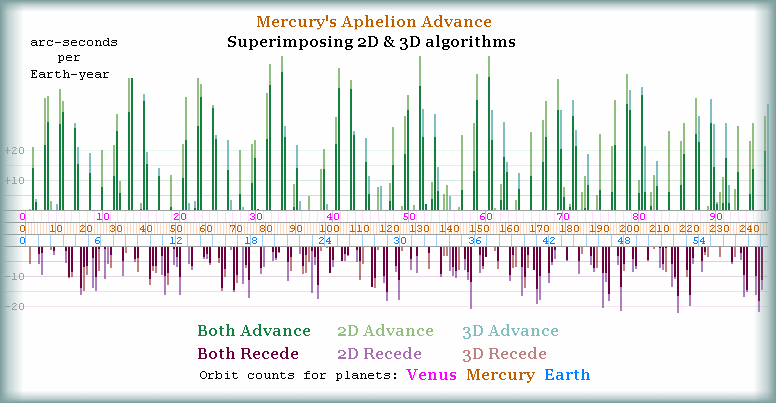
it should be abundantly clear from the table above that
F, & G, in my 2D
model give the same results as all other 2D
Newtonian models, as well as Horizon Ephemeris: about 5.5
as/Ey; whereas my 3D models give 4.8
as/Ey (A, B, C,
D, E) when measuring the angle standardized to
the X and Y ecliptic plain
- which all the other models do.
OGS15 uses start positions (for all planets)
obtained from Horizon Ephemeris. My assumption being that
the duration of the orbit of Mercury needs to be
met as a first priority (87.969 days).
Other details being less certain. It is highly likely that
the discrepancies in Mercury's distance at aphelion are
due to Horizon Ephemeris neglecting to properly account
for the role of the Z-axis in evolutionary
n-body gravity terms.
It is an unlikely coincidence that when describing an orbit
of 87.969 days the 2D
algorithm OGS13 generates a distance of
aphelion of 69 816 469 km for 1940/Apr/10.
When we compare that to Horizon's distance of aphelion:
69 813 570 km, for that same orbit, then this yields
a close comparison of just 0.004%.
But 69 802 219 km is
attained when comparing that exact same orbit with the 3D
scenario
[62];
which is a difference of -0.016%.
So it is quite clear that Horizon have accounted for alterations
to Kepler's orbit using a simplified statistical 2D
model for the gravity effects of the outer planets. They
have then simply angled Mercury's orbit the appropriate
7 degrees into 3D after
this.
They have not taken into account that in doing so, the gravity
of the other planets now has a significantly less effect
on the orbit of Mercury. It is a forgivable error to intuit
that 7 degrees (or 2%)
would yield little difference. The algorithmic fact however,
is that a 2% tilt gives a 13%
difference to the Perihelion Precession. With gravity in
the 3D model from the outer planets diluted
by the tilt on the Z-axis, Mercury is then
dragged forward by them less.
I
have caught them in a theoretical pincer movement now. Because
there are two quite distinct reasons to show that they have
first calculated the orbit, and then simply added the Z-axis
afterwards!
First the angle of their Perihelion Precession
is measured by excluding the Z-axis, then
their distance of aphelion fits more closely with the
2D evolution, than the 3D evolution.
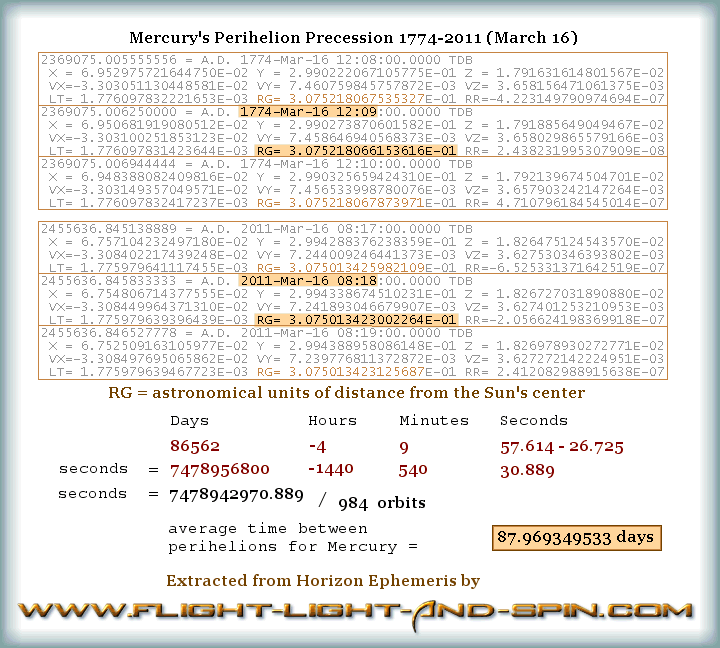
Due to these discrepancies I added the entire set of scenarios
beginning in 1900 to triple check the details.
And just for good measure, Scenario [62]
gave an average orbital duration for Mercury of 87.969276
days. That is a discrepancy with Horizon Ephemeris of 2
seconds to the given orbital duration over 474
years of evolution. The other scenarios differed by about
20 seconds, but that extra accuracy changed
matters nothing. Of course the effect of the gravity is
proportional.
Moreover if we look at other methods used to calculate Mercury's
distance of aphelion in a variety of places, it is clear
that virtually nobody makes any attempt to account for the
gravity of the other planets. And that Mercury's aphelion
is normally calculated as a Keplerian orbit.
So what I am claiming is that nobody else has even come
remotely close to properly computing a 3d-n-body-gravity
process according to the basic formula from Newton, being
simply: g=Gm/r^2.
My computational model can assess a computational accuracy
for the orbit of Mercury down to a fraction of a second;
or a fraction of a meter - over a century - using an entry-level
home computer and middle-range programming language. And
a fair bit of patience.
There is zero evidence that any Relativist ever took into
account the Z-axis in either evolutionary
terms for Newton, let alone Einstein's formula. Nor did
they take into account the Z-axis in measurement
terms either.
The biggest error in OGS15 is in trying
to find precise starting positions and velocities. All available
online sources for this data have systematically been calculated
using 2D ring-planet models or statistical
Keplerian processes. They have thus either completely ignored
the outer planets or over-emphasized their effects by neglecting
to take into account how these are diluted by axial tilts
on the Z-axis. Those with access to better
source data should be able to improve on my results using
the algorithm of OGS15. Better still, just
use the essential formula and figure out the starting velocities
and positions using entirely different dates in your own
application.
Scenarios [63] and [64]
use iterations of 1.5 seconds and 0.15
seconds respectively, but I no longer have access to those
old more advanced Windows XP dual core
computers, so my number-crunching capacity has become vastly
diminished.
The formula for n-body-gravity in 3d is
freely available to anyone later in this chapter/article
(How to Build
N-body-gravity Algorithm). You do not need
advanced equipment either. Even Windows 10
and a 4-core computer can give ok results.
If ever there was a reason to learn how to program a computer
this is it: